
Have you ever wondered when to invest and when to leave the markets for good?
At Newgate, we certainly did.
While many profitable investment strategies exist, most of them do not work well during all market conditions - especially the Buy & Hold strategy fails when prices keep going down for possibly months to come. The same challenge exists for more complex investment & trading strategies, whether they are based on a mean reversion approach or exploit trends as long as they last.
To make sense of the market, it may be helpful to have a look at
similar market conditions in the past and see how things were back then.
While a simple distinction between e.g. bull and bear markets could be
achieved by comparing the current price with a long-term moving average,
we at Newgate prefer a more flexible approach, that can be used to dynamically estimate arbitrary market characteristics, like:
- Which periods in the past were similar to the current market phase?
- Which returns can reasonably be expected in the current market phase?
- Which volatility should be expected?
- How well did a given trading strategy perform in similar market conditions?
Clustering Market Phases
Newgate uses a clustering approach to group historic market conditions by similarities on a daily basis. Typically, common price indicators can be used as input features, but the approach is flexible and can handle all kinds of features. The features for each day are fed into a clustering algorithm (e.g. K-Means clustering [1]), which assigns a cluster to each input day. Metrics of interest are then aggregated for each group.
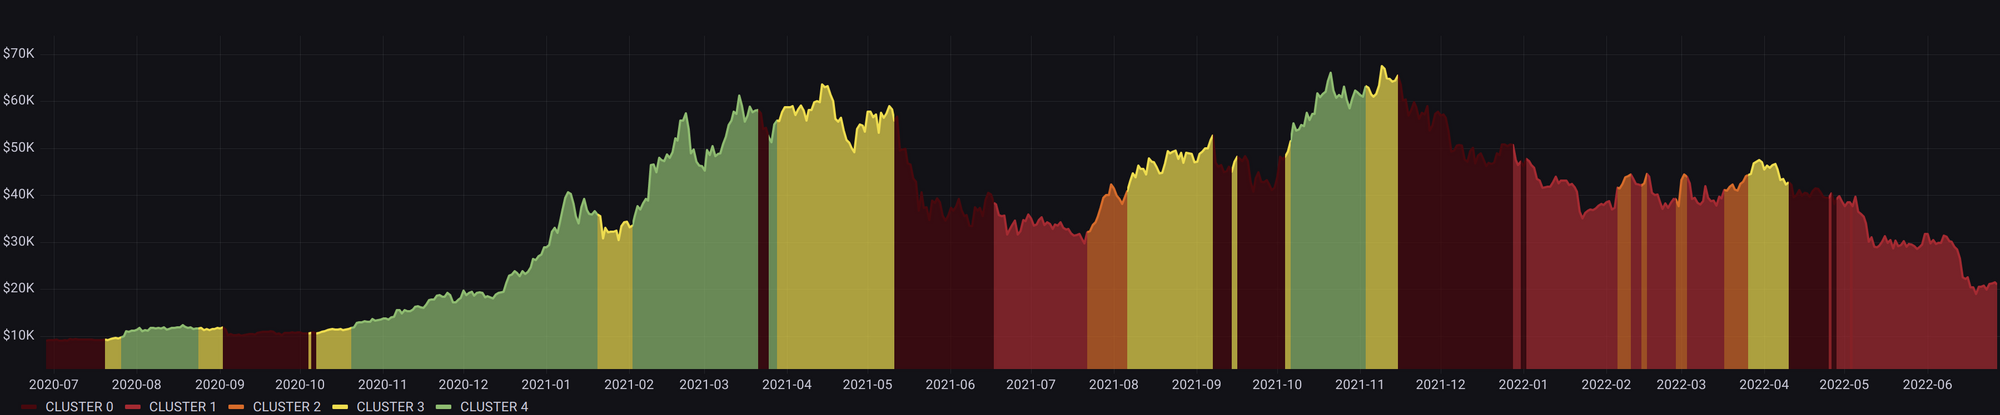
Bull and Bear market
For the classification of a bull or a bear phase, one can simply use the aggregated daily return of the current cluster:
If the mean return is positive, we classify the current day as "bull", and otherwise as "bear".
Cluster Robustness, or the Problem of Hindsight
When looking at the clusters over the entire available time frame, it may be tempting to directly apply a trading strategy. However, backtesting a trading strategy should never include data that is not yet available at the time of the forecast. Otherwise, the strategy is not reproducible when applied in real time and the backtest results are simply wrong. Therefore, we calculate clusters in an iterative way, where at each timestamp, clustering & metric aggregation is performed only based on past data.

The difference between calculating clusters only once and calculating it
separately for each time step is displayed in Figure 2. It is clearly visible, that the classified market phases are mostly identical, but the differences often occur in highly volatile phases that could make quite a difference. It is safe to assume, the latest (one-shot) clustering is more accurate, as it has more data available.
So, how would the rolling cluster evaluation perform, when
applying it in a simple trading strategy?

As it turns out, quite well. When applying the clustering on Bitcoin and investing only when the clustering algorithm classifies a bull market, possible drawdowns are greatly reduced. If this strategy had been applied since the beginning of 2019, one would have outperformed the Buy & Hold strategy by a 2x difference (state of June 2022).

In the case of Ethereum, the impact is even larger, with roughly a 5x difference in return! The final portfolio value is close to the maximum peak of Ethereum in November 2021.
Conclusion
With our Market Phase Clustering approach, we present a simple but effective tool, that both provides human interpretable insights as well as concrete signals, that may be used as an enhancement for existing trading strategies.
Disclaimer
This blog post is meant to give insights on machine learning use-cases in financial applications as developed by Newgate. The given information is not intended as investment advice. Newgate does not provide any financial advice.
References
[1] MacQueen, J. "Classification and analysis of multivariate observations." 5th Berkeley Symp. Math. Statist. Probability. 1967.